It can be hard to understand the Los Angeles real estate market by watching national trends. And it can be deceiving to try to figure out what's happening in your neighborhood by looking at Los Angeles as a whole because each neighborhood can be its own universe.
So for our market report that we'll update monthly, we've divided Los Angeles into three luxury real estate areas as follows:
- North Beach area, including the Pacific Palisades, Santa Monica, and Venice.
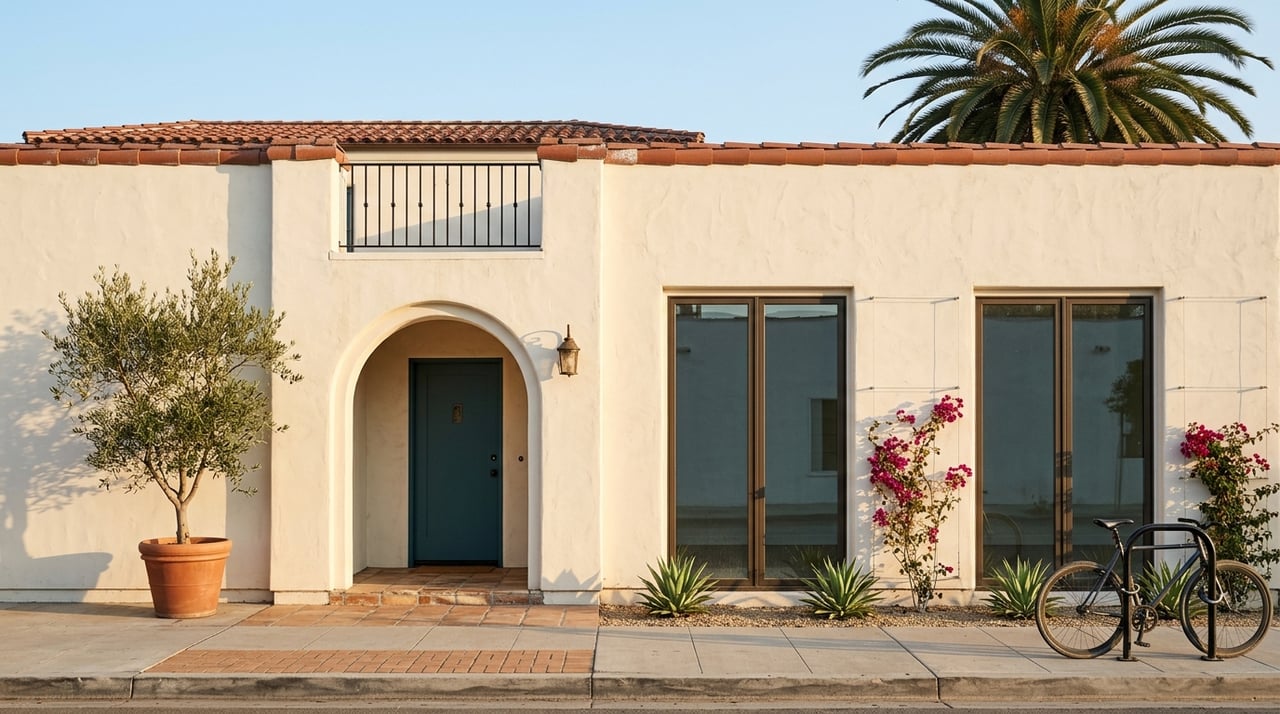
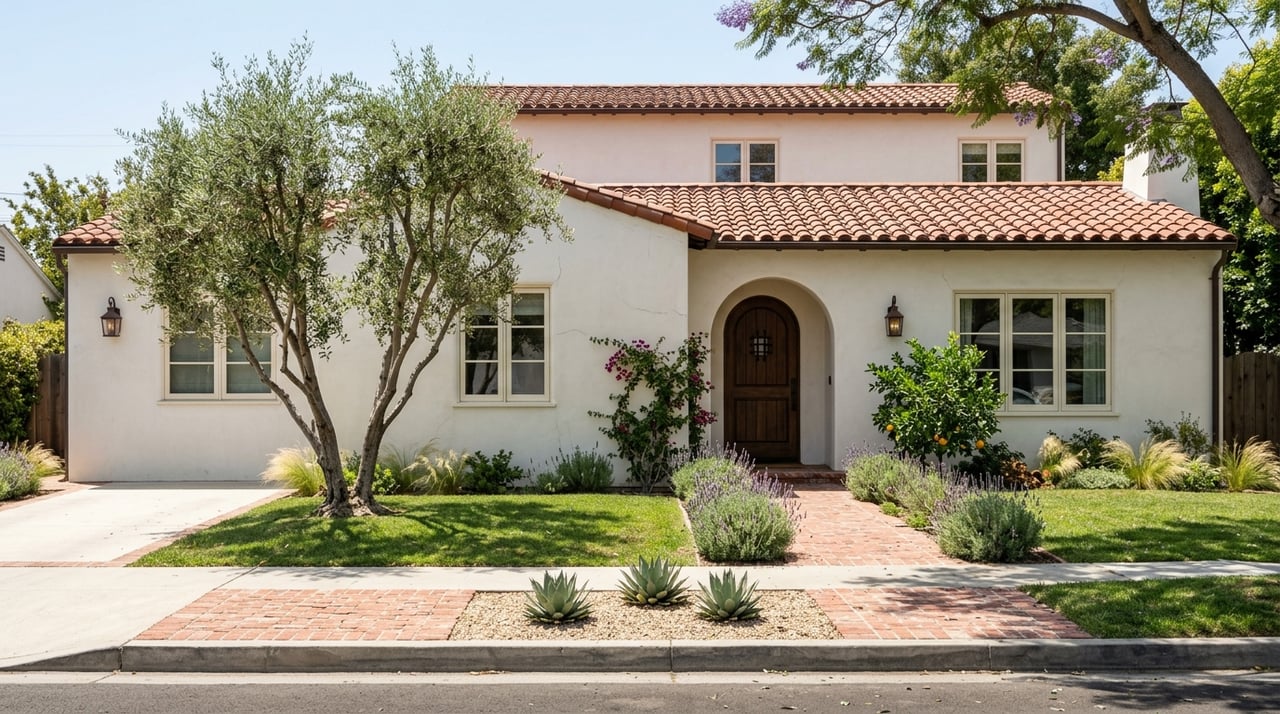
- Westside, including Beverly Hills, Brentwood, West Hollywood, and Westwood.
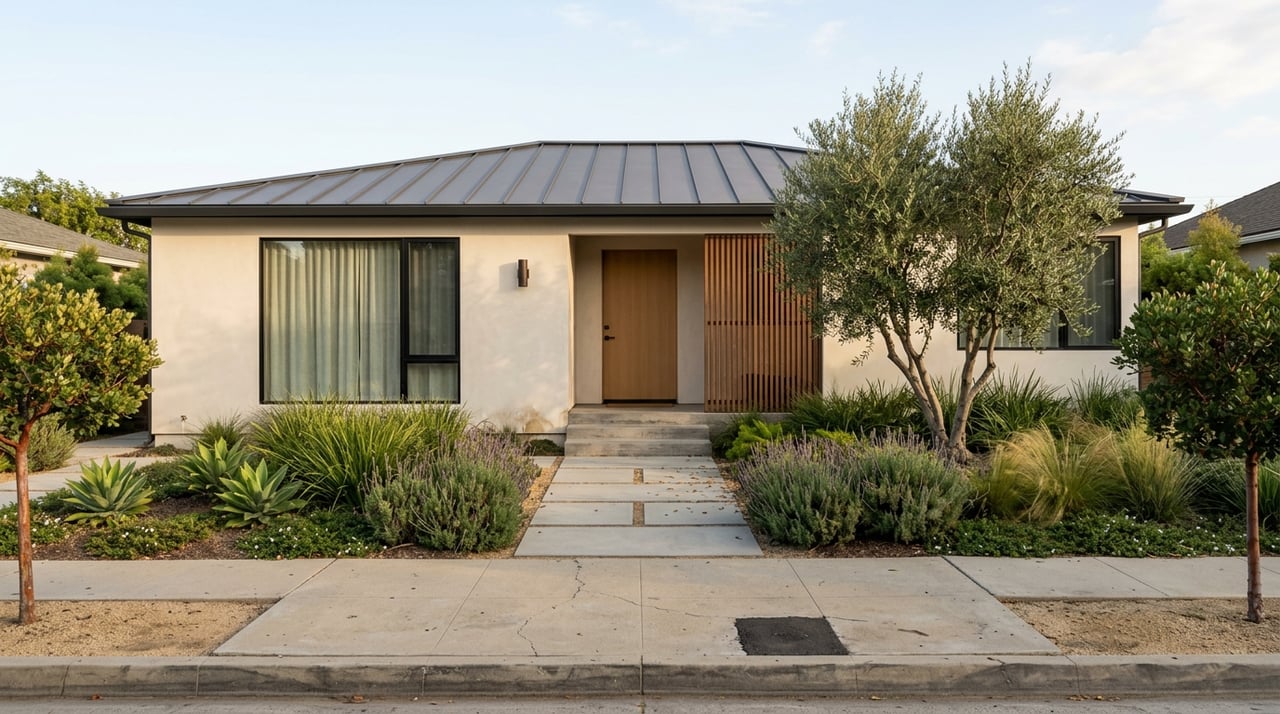
- South Bay, including Hermosa, Manhattan Beach, and Redondo.
Quick Take:
- Across Westside LA, the median home sale price is $2.2M, roughly flat year-over-year (-0.37%), with price per square foot at $949 (-2.7% YoY).
- Homes are taking somewhat longer to sell than a year ago — an average of 54 days versus 47 days last year — giving buyers modestly more negotiating room.
- May 2026 sales volume (628 homes) was up from 595 a year earlier, suggesting demand has held up even as prices have leveled off.
Westside home prices have held roughly flat over the past year
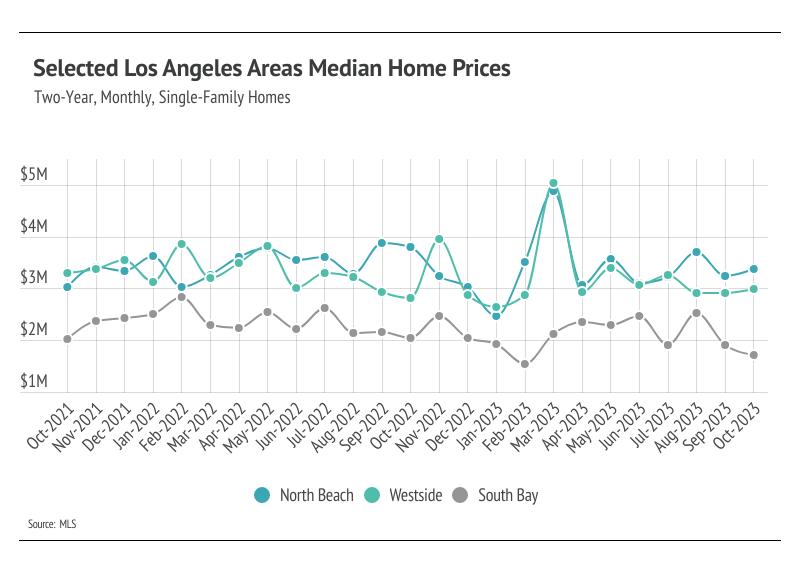
Home prices and inventory in luxury markets continue to show real month-to-month variability, driven by the unique nature of individual high-end homes, financing costs, and persistently low inventory. Across the broader Westside submarket, prices have been essentially flat over the past year even as the pace of sales has ticked up slightly — a sign the market has found a steadier footing than the sharper swings seen in 2022–2023.
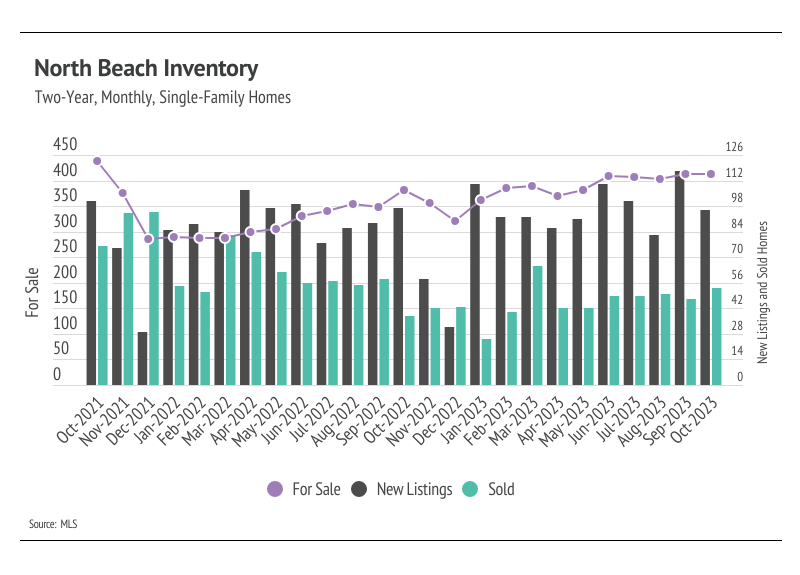
North Beach, Westside, and South Bay inventory levels vary by submarket
Individual Westside neighborhoods — Santa Monica, Pacific Palisades, Venice — are currently showing inconsistent swings across data sources depending on the exact time window and property mix compared, which is common in smaller luxury markets where a handful of sales can swing the median. Rather than restate outdated North Beach/Westside/South Bay percentage breakdowns from 2023, we recommend pulling fresh MLS-sourced figures for each submarket before republishing this report.
Looking for more information? Send us an email at [email protected] and we'll set up a time to chat!